Skip to content

Registration quality metrics

After running registration it is useful to verify how much better (or worse) a given transform key actually aligns the tiles compared to the initial positions. multiview_stitcher.metrics provides two functions for this purpose:

Function Purpose
metrics.tile_pair_image_metrics Compute image similarity metrics in the overlap region for every adjacent tile pair – supports two modes (see below)
vis_utils.plot_tile_pair_image_metrics Visualise the results as a positional tile graph and/or a summary overview plot

Two modes

tile_pair_image_metrics accepts exactly one of:

  • query_transform_keys (Mode 1) — pairs are derived automatically from spatial overlap; metrics are evaluated under each named transform key, enabling side-by-side comparison (e.g. stage position vs. registered).
  • pairs_graph (Mode 2) — pairs and their transforms are taken directly from a pre-computed pairwise registration graph (e.g. g_reg_computed from registration.compute_pairwise_registrations). Each edge contributes one candidate. Useful for quality assessment and pair filtering between the pairwise and global resolution steps. base_transform_key is still required: it defines the overlap geometry and is used to convert each world-space edge transform into the intrinsic sampling convention (p_moving = inv(T_moving_base) @ T_edge @ T_fixed_base).

How it works (Mode 1)

The steps below apply to Mode 1 (query_transform_keys). In Mode 2 the pair list and candidate transforms come from the supplied pairs_graph; the overlap geometry and sampling steps (2–4) are identical.

1 – Overlap region (base_transform_key)

For each adjacent tile pair the overlap bounding box is computed in the world coordinate system defined by base_transform_key. An optional max_tolerance shrinks this box on every side, ensuring the comparison region stays fully inside both tiles even if the query transform deviates from the base by up to that physical distance.

2 – Fixed image in intrinsic space

The bounding box is projected into the intrinsic (physical) space of the fixed tile via inv(T_fixed_base). The fixed tile is always sampled with an identity transform, guaranteeing that exactly the same pixels contribute to the comparison regardless of which query key is being evaluated.

3 – Moving image under each query transform

For each query_transform_key the moving tile is resampled as:

$$ p_\text{moving} = T_\text{moving,q}^{-1} \cdot T_\text{fixed,q} $$

This means the relative placement of fixed and moving tiles reflects purely the query transforms, making metric values directly comparable across keys.

4 – Metric functions

Any callable with signature func(im1: np.ndarray, im2: np.ndarray) -> float can be used. NaN pixels (outside the image domain after resampling) are handled by the built-in normalized_cross_correlation; third-party metrics (e.g. from skimage.metrics) should be wrapped with functools.partial if extra arguments are needed.


Usage example

Mode 1 – compare multiple transform keys

import functools
import skimage.metrics
from multiview_stitcher import metrics, vis_utils

# --- compute metrics ---
metrics_result = metrics.tile_pair_image_metrics(
    msims,
    base_transform_key='cross_corr',        # defines overlap region
    query_transform_keys=[
        'cross_corr',
        'elastix_translation',
        'elastix_rigid',
    ],
    metric_funcs={
        'ncc':    metrics.normalized_cross_correlation,
        'struct': functools.partial(
            skimage.metrics.structural_similarity,
            data_range=1000,
        ),
    },
    max_tolerance=1,   # shrink comparison box by 1 physical unit on each side
)

# --- visualise (works with both modes) ---
vis_utils.plot_tile_pair_image_metrics(
    msims,
    metrics_result,
    base_transform_key='cross_corr',
    metric_key='struct',                    # which metric to colour-code
    query_transform_keys=[
        'cross_corr',
        'elastix_translation',
        'elastix_rigid',
    ],
    show_plot_positions=True,   # tile graph coloured by metric value per query key
    show_overview_plot=True,    # summary: per-pair lines + mean ± std across keys
)

Mode 2 – evaluate a pre-computed registration graph

from multiview_stitcher import metrics, registration

# g_reg_computed is the output of registration.compute_pairwise_registrations()
metrics_result = metrics.tile_pair_image_metrics(
    msims,
    base_transform_key='affine_metadata',
    pairs_graph=g_reg_computed,
)

Output – metrics_result

The returned dictionary has two top-level keys:

{
  "pairs": {
    (0, 1): {
      "cross_corr":          {"ncc": 0.91, "struct": 0.87},
      "elastix_translation": {"ncc": 0.95, "struct": 0.93},
      ...
    },
    ...
  },
  "summary": {
    "cross_corr":          {"ncc": 0.88, "struct": 0.84},
    "elastix_translation": {"ncc": 0.94, "struct": 0.91},
    ...
  }
}

All metric values are plain Python float.


Visualisation

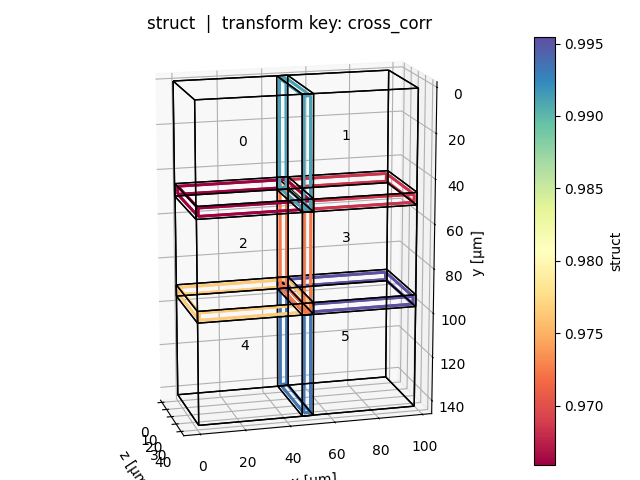
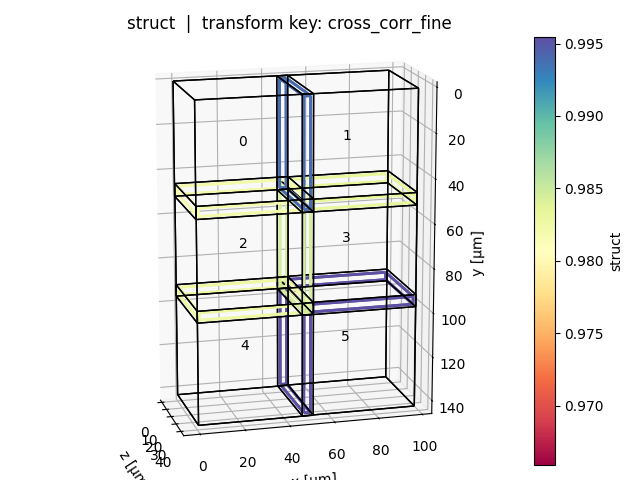
Positional plot (show_plot_positions=True)

One plot per query key: tiles are shown in world space, edges between adjacent tile pairs are coloured by the selected metric value (blue = high, red = low). Tile bounding boxes can be toggled with show_bboxes.

alt text

alt text

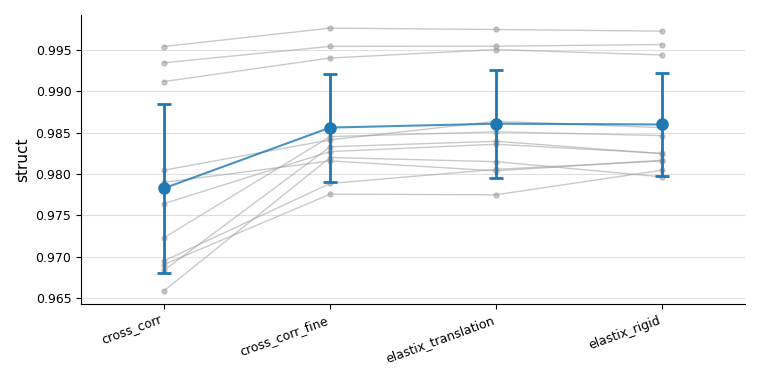
Overview plot (show_overview_plot=True)

A single figure showing all tile pairs as grey lines across query keys, with a blue mean ± std trend on top. This makes it easy to see at a glance whether a registration method improved alignment consistently across all pairs.

alt text


API reference

Registration quality metrics for multiview-stitcher.

This module provides tools to assess the quality of image registration by comparing image content in the overlap regions between adjacent views, after pre-transforming them according to one or more candidate transform keys.

Main entry point: tile_pair_image_metrics.

Built-in metric function

normalized_cross_correlation – normalised cross-correlation (NCC) between two images that may contain NaN values in non-overlapping areas.

Additional metric functions, such as those from :mod:skimage.metrics, can be passed through the metric_funcs argument as long as they conform to the signature func(im1: np.ndarray, im2: np.ndarray) -> float.

tile_pair_image_metrics(msims, base_transform_key, query_transform_keys=None, metric_funcs=None, max_tolerance=None, spacing=None, bidirectional=False, metric_channel=None, n_parallel_pairs=None, input_res_level=None, *, pairs_graph=None)

Calculate registration quality metrics for a list of views.

Two modes are supported, selected by providing exactly one of query_transform_keys (Mode 1) or pairs_graph (Mode 2):

Mode 1 – pairs are determined automatically from the spatial overlap of the views under base_transform_key; metrics are evaluated under each of the supplied query_transform_keys, enabling comparison across multiple candidate transforms (e.g. stage vs. registered).

Mode 2 – pairs and their transforms are taken directly from a pre-computed pairwise registration graph (pairs_graph, e.g. g_reg_computed from :func:registration.compute_pairwise_registrations). Each edge contributes one candidate (its "transform" attribute). Useful for quality assessment and pair filtering between the pairwise registration and global resolution steps. base_transform_key is still required in this mode: it is used both to determine the overlap region between each pair of views and to convert the world-space edge transform into the intrinsic sampling convention (p_moving = inv(T_moving_base) @ T_edge @ T_fixed_base).

For each pair the function:

  1. Uses base_transform_key to determine the overlap region between the two views and computes a comparison bounding box (optionally shrunk by max_tolerance from the overlap boundary).
  2. Projects the comparison bbox into the fixed image's intrinsic (physical) space via inv(T_fixed_base). The fixed image is sampled with an identity transform (always the same pixels across all query keys). The moving image is sampled with inv(T_moving_q) @ T_fixed_q, i.e. fixed-intrinsic → world via the query fixed transform, then world → moving-intrinsic. The relative positioning of fixed and moving therefore reflects exclusively the query-key transforms, making metrics comparable across keys.
  3. Applies every metric function to the pre-transformed image pair.

Only the first time point (and first channel) of each view is used.

Parameters

msims : list of MultiscaleSpatialImage Input views. base_transform_key : str Transform key that defines the reference spatial layout. Used in both modes to (1) compute the overlap region between each pair of views and (2) position the fixed image for sampling. In Mode 2 it is additionally used to convert the world-space edge transform from pairs_graph into the intrinsic sampling convention: p_moving = inv(T_moving_base) @ T_edge @ T_fixed_base. query_transform_keys : str or list of str, optional Mode 1 — one or more transform keys to evaluate. Each key must exist in every input view. Mutually exclusive with pairs_graph. metric_funcs : dict[str, callable], optional Maps arbitrary string keys to metric functions. Each function must have the signature func(im1: np.ndarray, im2: np.ndarray) -> float. NaN values in the pre-transformed images (outside the image domain) can occur and the metric functions should handle them gracefully. Defaults to {"ncc": normalized_cross_correlation}.

To pass additional keyword arguments to a metric function, wrap it
with :func:`functools.partial` before including it in the dict::

    from functools import partial
    from skimage.metrics import structural_similarity

    metric_funcs = {
        "ncc": metrics.normalized_cross_correlation,
        "ssim": partial(structural_similarity, data_range=1.0),
    }

max_tolerance : float, dict, or None, optional Physical distance by which the comparison bbox is shrunk on every side relative to the overlap boundary. This guarantees that the comparison bbox remains valid for any query transform that deviates from the base by at most max_tolerance physical units. Pixels that are included in the axis-aligned comparison bbox but lie outside of the shrunk overlap halfspace intersection are set to NaN before metric evaluation. A float value is applied uniformly across all spatial dimensions; a dict maps spatial dim names to per-dimension values. None means no shrinkage. spacing : dict or None, optional Spacing at which images are pretransformed before metric evaluation. A dict maps spatial dim names to per-dimension values. None (default) uses the finest spacing of the fixed image for each pair, preserving the full resolution of the reference view. bidirectional : bool, optional When False (default) only one directed edge per adjacent pair is built, with the lower view index as fixed and the higher as moving. This halves the computation cost. When True both directions (i → j) and (j → i) are evaluated independently. metric_channel : scalar or None, optional Channel coordinate value to use when selecting the channel for metric computation. When None (default) the channel at index 0 is used. Has no effect for views without a "c" dimension. n_parallel_pairs : int or None, optional Maximum number of directed pairs to compute in parallel. When None (default) all pairs are computed in a single :func:dask.compute call. For 3D data this defaults to 1 to limit memory usage. Setting this to a small integer batches the computation, reducing peak memory at the cost of reduced parallelism. input_res_level : int or None, optional Resolution level index used to select the image scale for metric computation. 0 is the finest level ("scale0"), 1 is "scale1", etc.

* When ``None`` and *spacing* is also ``None``: defaults to ``0``
  (finest resolution).
* When ``None`` and *spacing* is provided: the coarsest level whose
  actual spacing is still ≤ *spacing*, selected independently for
  each pair, based on the fixed image.

pairs_graph : nx.Graph, optional Mode 2 — a pre-computed pairwise registration graph (e.g. g_reg_computed returned by :func:registration.compute_pairwise_registrations). Each edge must carry a "transform" attribute (the world-space pairwise affine, lower-index view → higher-index view). The edges define which pairs are evaluated; each edge contributes a single candidate transform. Mutually exclusive with query_transform_keys. The output "pairs" dict uses "transform" as the candidate key.

Returns

dict with keys:

  • "pairs" – :class:dict mapping directional-pair tuples (fixed_idx, moving_idx) to dicts of the form {candidate_key: {metric_key: float}}, where candidate_key is a query transform key name (Mode 1) or "transform" (Mode 2).
  • "summary" – :class:dict mapping query_transform_key to {metric_key: float} where each value is the overlap-volume-weighted mean across all directional pairs. The weight for each pair is the physical volume of the overlap region (as returned by :func:mv_graph.get_overlap_between_pair_of_stack_props). Pairs whose metric value is NaN are excluded from both the numerator and denominator.
Source code in src/multiview_stitcher/metrics.py
388
389
390
391
392
393
394
395
396
397
398
399
400
401
402
403
404
405
406
407
408
409
410
411
412
413
414
415
416
417
418
419
420
421
422
423
424
425
426
427
428
429
430
431
432
433
434
435
436
437
438
439
440
441
442
443
444
445
446
447
448
449
450
451
452
453
454
455
456
457
458
459
460
461
462
463
464
465
466
467
468
469
470
471
472
473
474
475
476
477
478
479
480
481
482
483
484
485
486
487
488
489
490
491
492
493
494
495
496
497
498
499
500
501
502
503
504
505
506
507
508
509
510
511
512
513
514
515
516
517
518
519
520
521
522
523
524
525
526
527
528
529
530
531
532
533
534
535
536
537
538
539
540
541
542
543
544
545
546
547
548
549
550
551
552
553
554
555
556
557
558
559
560
561
562
563
564
565
566
567
568
569
570
571
572
573
574
575
576
577
578
579
580
581
582
583
584
585
586
587
588
589
590
591
592
593
594
595
596
597
598
599
600
601
602
603
604
605
606
607
608
609
610
611
612
613
614
615
616
617
618
619
620
621
622
623
624
625
626
627
628
629
630
631
632
633
634
635
636
637
638
639
640
641
642
643
644
645
646
647
648
649
650
651
652
653
654
655
656
657
658
659
660
661
662
663
664
665
666
667
668
669
670
671
672
673
674
675
676
677
678
679
680
681
682
683
684
685
686
687
688
689
690
691
692
693
694
695
696
697
698
699
700
701
702
703
704
705
706
707
708
709
710
711
712
713
714
715
716
717
718
719
720
721
722
723
724
725
726
727
728
729
730
731
732
733
734
735
736
737
738
739
740
741
742
743
744
745
746
747
748
749
750
751
752
753
754
755
756
757
758
759
760
761
762
763
764
765
766
767
768
769
770
771
772
773
774
775
776
777
778
779
780
781
782
783
784
785
786
787
788
789
790
791
792
793
794
795
796
797
798
799
800
801
802
803
804
def tile_pair_image_metrics(
    msims,
    base_transform_key,
    query_transform_keys=None,
    metric_funcs=None,
    max_tolerance=None,
    spacing=None,
    bidirectional=False,
    metric_channel=None,
    n_parallel_pairs=None,
    input_res_level=None,
    *,
    pairs_graph=None,
):
    """
    Calculate registration quality metrics for a list of views.

    Two modes are supported, selected by providing exactly one of
    ``query_transform_keys`` (Mode 1) or ``pairs_graph`` (Mode 2):

    **Mode 1** – pairs are determined automatically from the spatial overlap
    of the views under ``base_transform_key``; metrics are evaluated under
    each of the supplied ``query_transform_keys``, enabling comparison across
    multiple candidate transforms (e.g. stage vs. registered).

    **Mode 2** – pairs and their transforms are taken directly from a
    pre-computed pairwise registration graph (``pairs_graph``, e.g.
    ``g_reg_computed`` from :func:`registration.compute_pairwise_registrations`).
    Each edge contributes one candidate (its ``"transform"`` attribute).
    Useful for quality assessment and pair filtering between the pairwise
    registration and global resolution steps.
    ``base_transform_key`` is still required in this mode: it is used both
    to determine the overlap region between each pair of views *and* to
    convert the world-space edge transform into the intrinsic sampling
    convention (``p_moving = inv(T_moving_base) @ T_edge @ T_fixed_base``).

    For each pair the function:

    1. Uses *base_transform_key* to determine the overlap region between
       the two views and computes a *comparison bounding box* (optionally
       shrunk by *max_tolerance* from the overlap boundary).
    2. Projects the comparison bbox into the **fixed image's intrinsic
       (physical) space** via ``inv(T_fixed_base)``.  The fixed image is
       sampled with an identity transform (always the same pixels across
       all query keys).  The moving image is sampled with
       ``inv(T_moving_q) @ T_fixed_q``, i.e. fixed-intrinsic → world via
       the *query* fixed transform, then world → moving-intrinsic.  The
       relative positioning of fixed and moving therefore reflects
       exclusively the query-key transforms, making metrics comparable
       across keys.
    3. Applies every metric function to the pre-transformed image pair.

    Only the first time point (and first channel) of each view is used.

    Parameters
    ----------
    msims : list of MultiscaleSpatialImage
        Input views.
    base_transform_key : str
        Transform key that defines the reference spatial layout.  Used
        in **both modes** to (1) compute the overlap region between each
        pair of views and (2) position the fixed image for sampling.  In
        Mode 2 it is additionally used to convert the world-space edge
        transform from ``pairs_graph`` into the intrinsic sampling
        convention: ``p_moving = inv(T_moving_base) @ T_edge @ T_fixed_base``.
    query_transform_keys : str or list of str, optional
        *Mode 1* — one or more transform keys to evaluate.  Each key must
        exist in every input view.  Mutually exclusive with ``pairs_graph``.
    metric_funcs : dict[str, callable], optional
        Maps arbitrary string keys to metric functions.  Each function
        must have the signature
        ``func(im1: np.ndarray, im2: np.ndarray) -> float``.
        NaN values in the pre-transformed images (outside the image
        domain) can occur and the metric functions should
        handle them gracefully.
        Defaults to ``{"ncc": normalized_cross_correlation}``.

        To pass additional keyword arguments to a metric function, wrap it
        with :func:`functools.partial` before including it in the dict::

            from functools import partial
            from skimage.metrics import structural_similarity

            metric_funcs = {
                "ncc": metrics.normalized_cross_correlation,
                "ssim": partial(structural_similarity, data_range=1.0),
            }
    max_tolerance : float, dict, or None, optional
        Physical distance by
        which the comparison bbox is shrunk on every side relative to the
        overlap boundary. This guarantees that the comparison bbox
        remains valid for any query transform that deviates from the base
        by at most *max_tolerance* physical units. Pixels that are included
        in the axis-aligned comparison bbox but lie outside of the
        shrunk overlap halfspace intersection are set to NaN before metric evaluation.
        A float value is applied uniformly across all spatial dimensions;
        a dict maps spatial dim names to per-dimension values.
        ``None`` means no shrinkage.
    spacing : dict or None, optional
        Spacing at which images are pretransformed before metric
        evaluation.  A dict maps spatial dim names to per-dimension
        values.  ``None`` (default) uses the finest spacing of the fixed
        image for each pair, preserving the full resolution of the
        reference view.
    bidirectional : bool, optional
        When ``False`` (default) only one directed edge per adjacent pair is
        built, with the lower view index as fixed and the higher as moving.
        This halves the computation cost.  When ``True`` both directions
        ``(i → j)`` and ``(j → i)`` are evaluated independently.
    metric_channel : scalar or None, optional
        Channel coordinate value to use when selecting the channel for metric
        computation.  When ``None`` (default) the channel at index 0 is used.
        Has no effect for views without a ``"c"`` dimension.
    n_parallel_pairs : int or None, optional
        Maximum number of directed pairs to compute in parallel.  When
        ``None`` (default) all pairs are computed in a single :func:`dask.compute`
        call.  For 3D data this defaults to ``1`` to limit memory usage.
        Setting this to a small integer batches the computation, reducing peak
        memory at the cost of reduced parallelism.
    input_res_level : int or None, optional
        Resolution level index used to select the image scale for metric
        computation.  ``0`` is the finest level (``"scale0"``), ``1`` is
        ``"scale1"``, etc.

        * When ``None`` and *spacing* is also ``None``: defaults to ``0``
          (finest resolution).
        * When ``None`` and *spacing* is provided: the coarsest level whose
          actual spacing is still ≤ *spacing*, selected independently for
          each pair, based on the fixed image.
    pairs_graph : nx.Graph, optional
        *Mode 2* — a pre-computed pairwise registration graph (e.g.
        ``g_reg_computed`` returned by
        :func:`registration.compute_pairwise_registrations`).  Each edge
        must carry a ``"transform"`` attribute (the world-space pairwise
        affine, lower-index view → higher-index view).  The edges define
        which pairs are evaluated; each edge contributes a single candidate
        transform.  Mutually exclusive with ``query_transform_keys``.
        The output ``"pairs"`` dict uses ``"transform"`` as the candidate
        key.

    Returns
    -------
    dict with keys:

    * ``"pairs"`` – :class:`dict` mapping directional-pair tuples
      ``(fixed_idx, moving_idx)`` to dicts of the form
      ``{candidate_key: {metric_key: float}}``, where ``candidate_key``
      is a query transform key name (Mode 1) or ``"transform"`` (Mode 2).
    * ``"summary"`` – :class:`dict` mapping *query_transform_key* to
      ``{metric_key: float}`` where each value is the **overlap-volume-weighted
      mean** across all directional pairs.  The weight for each pair is the
      physical volume of the overlap region (as returned by
      :func:`mv_graph.get_overlap_between_pair_of_stack_props`).  Pairs whose
      metric value is NaN are excluded from both the numerator and denominator.
    """
    if (query_transform_keys is None) == (pairs_graph is None):
        raise ValueError(
            "Exactly one of 'query_transform_keys' or 'pairs_graph' must be provided."
        )

    if metric_funcs is None:
        metric_funcs = {"ncc": normalized_cross_correlation}

    if query_transform_keys is not None:
        if isinstance(query_transform_keys, str):
            query_transform_keys = [query_transform_keys]
        candidate_keys = query_transform_keys
    else:
        candidate_keys = ["transform"]

    # Resolve input_res_level when not explicitly set.
    # Per-pair selection (input_res_level stays None) only happens when
    # spacing is provided; otherwise we fall back to the finest level.
    per_pair_res_level = False
    if input_res_level is None:
        if spacing is None:
            input_res_level = 0
        else:
            per_pair_res_level = True

    # Build sims_t0 for graph construction (overlap / adjacency).  When
    # the resolution level is fixed we use that level directly; for the
    # per-pair case we use scale0 here (transforms always come from scale0).
    graph_scale_key = "scale0" if per_pair_res_level else f"scale{input_res_level}"
    sims = [msi_utils.get_sim_from_msim(msim, scale=graph_scale_key) for msim in msims]
    spatial_dims = spatial_image_utils.get_spatial_dims_from_sim(sims[0])
    ndim = len(spatial_dims)

    # Select first time-point and chosen channel from each sim
    sims_t0 = []
    for sim in sims:
        sel = {}
        if "t" in sim.dims:
            sel["t"] = sim.coords["t"].values[0]
        if "c" in sim.dims:
            if metric_channel is None:
                sel["c"] = sim.coords["c"].values[0]
            else:
                sel["c"] = metric_channel
        if sel:
            sim = spatial_image_utils.sim_sel_coords(sim, sel)
        sims_t0.append(sim)

    # spacing is a dict or None; kept as-is for per-pair use inside the loop.
    spacing_global = spacing

    # Build directed metrics graph
    if query_transform_keys is not None:
        g_metrics = _build_metrics_graph(
            msims,
            sims_t0,
            base_transform_key,
            query_transform_keys,
            max_tolerance,
            bidirectional=bidirectional,
        )
    else:
        g_metrics = _build_metrics_graph_from_pairs_graph(
            msims,
            sims_t0,
            base_transform_key,
            pairs_graph,
            max_tolerance,
            bidirectional=bidirectional,
        )

    # -----------------------------------------------------------------------
    # Build delayed metric computations for every directed edge and every
    # query_transform_key.  The fixed-image transformation is computed
    # once per directed edge and reused for all query keys.
    # -----------------------------------------------------------------------
    metric_delayed = {}

    for fixed_idx, moving_idx in list(g_metrics.edges()):
        edge_data = g_metrics.edges[(fixed_idx, moving_idx)]
        comparison_bbox = edge_data["comparison_bbox"]
        transforms = edge_data["transforms"]
        intersection_halfspace = edge_data["intersection_halfspace"]
        vol=edge_data["vol"]

        # expand halfspace slightly to make sure it includes the boundary of the intersection
        fixed_spacing = spatial_image_utils.get_spacing_from_sim(sims_t0[fixed_idx], asarray=True)
        tol = 1e-3 * np.min(fixed_spacing)
        intersection_halfspace = mv_graph.expand_halfspace(intersection_halfspace, distance=tol)

        if comparison_bbox is None:
            logger.warning(
                "Empty comparison bbox for directed pair (%s%s), "
                "all metrics will be NaN.",
                fixed_idx,
                moving_idx,
            )
            metric_delayed[(fixed_idx, moving_idx)] = {
                q: {k: np.nan for k in metric_funcs} for q in candidate_keys
            }
            continue

        # Select the sims for metric computation at the appropriate resolution.
        if per_pair_res_level:
            pair_res_level = msi_utils.get_res_level_from_spacing(
                msims[fixed_idx], spacing
            )
            pair_scale_key = f"scale{pair_res_level}"
            def _get_sim_t0(msim, scale_key):
                sim = msi_utils.get_sim_from_msim(msim, scale=scale_key)
                sel = {}
                if "t" in sim.dims:
                    sel["t"] = sim.coords["t"].values[0]
                if "c" in sim.dims:
                    if metric_channel is None:
                        sel["c"] = sim.coords["c"].values[0]
                    else:
                        sel["c"] = metric_channel
                if sel:
                    sim = spatial_image_utils.sim_sel_coords(sim, sel)
                return sim
            sim_fixed = _get_sim_t0(msims[fixed_idx], pair_scale_key)
            sim_moving = _get_sim_t0(msims[moving_idx], pair_scale_key)
        else:
            sim_fixed = sims_t0[fixed_idx]
            sim_moving = sims_t0[moving_idx]

        lower_intrinsic = comparison_bbox["lower"]
        upper_intrinsic = comparison_bbox["upper"]

        # Resolve per-pair spacing: use caller-supplied dict or fall back to
        # the spacing of the resolution level corresponding to input_res_level
        # for the fixed image (sim_fixed already comes from that level).
        if spacing_global is not None:
            spacing_d = spacing_global
        else:
            spacing_d = spatial_image_utils.get_spacing_from_sim(sim_fixed)

        shape = {
            dim: max(
                1,
                int(np.floor(
                    (upper_intrinsic[idim] - lower_intrinsic[idim]) / spacing_d[dim] + 1
                )),
            )
            for idim, dim in enumerate(spatial_dims)
        }

        # output_sp is in fixed-image intrinsic (physical) space
        output_sp = {
            "origin": {
                dim: float(lower_intrinsic[idim]) for idim, dim in enumerate(spatial_dims)
            },
            "spacing": {
                dim: float(spacing_d[dim]) for dim in spatial_dims
            },
            "shape": {
                dim: int(shape[dim]) for dim in spatial_dims
            },
        }

        # Fixed image: identity transform — output space IS fixed-intrinsic
        # space, so the fixed image is read out directly with no resampling.
        # This is computed once per directed edge and shared across all query
        # keys, guaranteeing identical fixed-image content for every comparison.
        sim_fixed_t = transformation.transform_sim(
            sim_fixed.astype(np.float32),
            p=np.eye(ndim + 1),
            output_stack_properties=output_sp,
            mode="constant",
            cval=np.nan,
            order=1,
        )

        # Moving image: for each candidate key retrieve the pre-computed
        # p_moving (fixed-intrinsic → moving-intrinsic) stored on the edge.
        metric_delayed[(fixed_idx, moving_idx)] = {}

        for q in candidate_keys:
            p_moving = transforms[q]

            sim_moving_t = transformation.transform_sim(
                sim_moving.astype(np.float32),
                p=p_moving,
                output_stack_properties=output_sp,
                mode="constant",
                cval=np.nan,
            )

            metric_d = delayed(_compute_metrics_from_arrays)(
                sim_fixed_t,
                sim_moving_t,
                metric_funcs,
                intersection_halfspace.halfspaces,
            )
            metric_delayed[(fixed_idx, moving_idx)][q] = metric_d

    # Compute all pairs and all query keys in parallel,
    # optionally batched to limit peak memory usage.

    if n_parallel_pairs is None and ndim == 3:
        n_parallel_pairs = 1
        logger.info("Setting n_parallel_pairs to 1 for 3D data")

    if n_parallel_pairs is None:
        logger.info("Computing metrics for all pairs in parallel")
        computed = compute(metric_delayed)[0]
    else:
        logger.info("Computing metrics for %s pair(s) in parallel", n_parallel_pairs)
        computed = {}
        all_pairs = list(metric_delayed.keys())
        for i in range(0, len(all_pairs), n_parallel_pairs):
            batch_pairs = all_pairs[i : i + n_parallel_pairs]
            batch = {p: metric_delayed[p] for p in batch_pairs}
            computed.update(compute(batch)[0])

    # Store computed metrics back on the graph edges
    for fixed_idx, moving_idx in g_metrics.edges():
        g_metrics.edges[(fixed_idx, moving_idx)]["metrics"] = computed[
            (fixed_idx, moving_idx)
        ]

    # -----------------------------------------------------------------------
    # Summarise: overlap-volume-weighted mean over all directed pairs,
    # per query key, per metric key
    # -----------------------------------------------------------------------
    summary = {}
    for q in candidate_keys:
        summary[q] = {}
        for metric_key in metric_funcs:
            values_and_weights = [
                (
                    float(computed[(fi, mi)][q].get(metric_key, np.nan)),
                    float(g_metrics.edges[(fi, mi)]["vol"]),
                )
                for fi, mi in g_metrics.edges()
            ]
            valid = [(v, w) for v, w in values_and_weights if not np.isnan(v)]
            if valid:
                vals, weights = zip(*valid)
                total_w = sum(weights)
                summary[q][metric_key] = (
                    float(sum(v * w for v, w in zip(vals, weights)) / total_w)
                    if total_w > 0
                    else np.nan
                )
            else:
                summary[q][metric_key] = np.nan

    return {
        "pairs": {
            (fi, mi): {
                q: computed[(fi, mi)][q] for q in candidate_keys
            }
            for fi, mi in g_metrics.edges()
        },
        "bboxes": {
            (fi, mi): g_metrics.edges[(fi, mi)]["comparison_bbox"]
            for fi, mi in g_metrics.edges()
        },
        "summary": summary,
    }

normalized_cross_correlation(im1, im2)

Compute the normalised cross-correlation (NCC) between two images.

NaN pixels present in either image are excluded from the computation.

Parameters

im1 : array-like First image (fixed). Arbitrary shape; must match im2. im2 : array-like Second image (moving). Arbitrary shape; must match im1.

Returns

float NCC value in the range [-1, 1]. Returns np.nan when fewer than two overlapping (non-NaN) pixels are available or when either image is constant.

Source code in src/multiview_stitcher/metrics.py
def normalized_cross_correlation(im1, im2):
    """
    Compute the normalised cross-correlation (NCC) between two images.

    NaN pixels present in either image are excluded from the computation.

    Parameters
    ----------
    im1 : array-like
        First image (fixed). Arbitrary shape; must match ``im2``.
    im2 : array-like
        Second image (moving). Arbitrary shape; must match ``im1``.

    Returns
    -------
    float
        NCC value in the range [-1, 1].  Returns ``np.nan`` when fewer than
        two overlapping (non-NaN) pixels are available or when either image
        is constant.
    """
    a = np.asarray(im1, dtype=np.float64)
    b = np.asarray(im2, dtype=np.float64)

    mask = ~(np.isnan(a) | np.isnan(b))
    if np.sum(mask) < 2:
        return np.nan

    a = a[mask]
    b = b[mask]

    a_c = a - a.mean()
    b_c = b - b.mean()

    denom = np.sqrt(np.sum(a_c**2) * np.sum(b_c**2))
    if denom < 1e-10:
        return np.nan

    return float(np.dot(a_c, b_c) / denom)

plot_tile_pair_image_metrics(msims, reg_metrics_result, base_transform_key, query_transform_keys, metric_key=None, clims=None, show_bboxes=True, show_overview_plot=False, overview_pair_linewidth=1.0, show_plot_positions=True)

Visualise registration quality metrics for each query transform key.

For every entry in query_transform_keys a separate figure is produced. Each figure shows the tile layout in that query transform key's world coordinate space and overlays either the pairwise comparison bounding boxes (when show_bboxes is True) or a minimalistic graph where edges are coloured by the metric value (when show_bboxes is False).

The comparison bboxes, which are originally defined in base_transform_key world space, are projected into each query key's world space via T_fixed_q @ inv(T_fixed_base) (applied to the fixed tile of each pair) before being drawn.

All figures share the same colorbar limits, derived by default from the base_transform_key metric values when it is included as a query key, so all other query keys are compared against the same reference scale.

Parameters

msims : list of MultiscaleSpatialImage The input views, passed unchanged to :func:plot_positions. reg_metrics_result : dict The dictionary returned by :func:multiview_stitcher.metrics.tile_pair_image_metrics. Must contain the "pairs" and "bboxes" keys. base_transform_key : str Transform key used to define the original comparison bboxes and to set colorbar limits when it appears in query_transform_keys. query_transform_keys : str or list of str Subset of transform keys to visualise. Each key must appear in reg_metrics_result["pairs"]. Tile positions and comparison bboxes are shown in each key's own world coordinate space. metric_key : str, optional Name of the metric to use for colouring the comparison boxes or edges. Defaults to the first metric key found in the result. clims : tuple of (float, float), optional Explicit (vmin, vmax) for the shared colorbar. When None (default) the limits are computed from base_transform_key values if that key is present in the result, falling back to all query-key values otherwise. show_bboxes : bool, optional When True (default) the comparison bounding boxes are drawn and coloured by metric value. When False a minimalistic :func:plot_positions plot is produced instead, where edges between adjacent tiles are coloured by the (mean of the two directed) metric values. show_overview_plot : bool, optional When True, produce one additional figure showing a paired plot with query_transform_keys on the x-axis and the metric value on the y-axis for each pair. A mean ± std summary (black diamond + error bar) is overlaid for each transform key. By default False. overview_pair_linewidth : float, optional Line width for the per-pair lines in the overview plot. Set to 0 to suppress the lines entirely and show only the mean ± std summary markers. By default 1.0. show_plot_positions : bool, optional When True (default) the per-query-key positional plots (tile layout with coloured comparison bboxes or coloured edges) are produced. Set to False to skip them, e.g. when only the overview plot is needed.

Returns

dict[str, tuple[matplotlib.figure.Figure, matplotlib.axes.Axes]] Maps each query transform key to its (fig, ax) pair.

Source code in src/multiview_stitcher/vis_utils.py
def plot_tile_pair_image_metrics(
    msims,
    reg_metrics_result,
    base_transform_key,
    query_transform_keys,
    metric_key=None,
    clims=None,
    show_bboxes=True,
    show_overview_plot=False,
    overview_pair_linewidth=1.0,
    show_plot_positions=True,
):
    """
    Visualise registration quality metrics for each query transform key.

    For every entry in *query_transform_keys* a separate figure is produced.
    Each figure shows the tile layout **in that query transform key's world
    coordinate space** and overlays either the pairwise comparison bounding
    boxes (when *show_bboxes* is ``True``) or a minimalistic graph where edges
    are coloured by the metric value (when *show_bboxes* is ``False``).

    The comparison bboxes, which are originally defined in *base_transform_key*
    world space, are projected into each query key's world space via
    ``T_fixed_q @ inv(T_fixed_base)`` (applied to the fixed tile of each pair)
    before being drawn.

    All figures share the same colorbar limits, derived by default from the
    *base_transform_key* metric values when it is included as a query key,
    so all other query keys are compared against the same reference scale.

    Parameters
    ----------
    msims : list of MultiscaleSpatialImage
        The input views, passed unchanged to :func:`plot_positions`.
    reg_metrics_result : dict
        The dictionary returned by :func:`multiview_stitcher.metrics.tile_pair_image_metrics`.
        Must contain the ``"pairs"`` and ``"bboxes"`` keys.
    base_transform_key : str
        Transform key used to define the original comparison bboxes and to set
        colorbar limits when it appears in *query_transform_keys*.
    query_transform_keys : str or list of str
        Subset of transform keys to visualise.  Each key must appear in
        *reg_metrics_result["pairs"]*.  Tile positions and comparison bboxes
        are shown in each key's own world coordinate space.
    metric_key : str, optional
        Name of the metric to use for colouring the comparison boxes or edges.
        Defaults to the first metric key found in the result.
    clims : tuple of (float, float), optional
        Explicit ``(vmin, vmax)`` for the shared colorbar.  When ``None``
        (default) the limits are computed from *base_transform_key* values
        if that key is present in the result, falling back to all query-key
        values otherwise.
    show_bboxes : bool, optional
        When ``True`` (default) the comparison bounding boxes are drawn and
        coloured by metric value.  When ``False`` a minimalistic
        :func:`plot_positions` plot is produced instead, where edges between
        adjacent tiles are coloured by the (mean of the two directed)
        metric values.
    show_overview_plot : bool, optional
        When ``True``, produce one additional figure showing a paired plot
        with *query_transform_keys* on the x-axis and the metric value on the
        y-axis for each pair.  A mean ± std summary (black diamond + error
        bar) is overlaid for each transform key.  By default ``False``.
    overview_pair_linewidth : float, optional
        Line width for the per-pair lines in the overview plot.  Set to
        ``0`` to suppress the lines entirely and show only the mean ± std
        summary markers.  By default ``1.0``.
    show_plot_positions : bool, optional
        When ``True`` (default) the per-query-key positional plots (tile
        layout with coloured comparison bboxes or coloured edges) are
        produced.  Set to ``False`` to skip them, e.g. when only the
        overview plot is needed.

    Returns
    -------
    dict[str, tuple[matplotlib.figure.Figure, matplotlib.axes.Axes]]
        Maps each query transform key to its ``(fig, ax)`` pair.
    """
    if isinstance(query_transform_keys, str):
        query_transform_keys = [query_transform_keys]

    pairs_dict = reg_metrics_result["pairs"]
    bboxes_dict = reg_metrics_result.get("bboxes", {})

    sims = [msi_utils.get_sim_from_msim(msim) for msim in msims]
    spatial_dims = spatial_image_utils.get_spatial_dims_from_sim(sims[0])

    # Collect all available metric keys from the result
    available_metric_keys = set()
    for q_metrics in pairs_dict.values():
        for m in q_metrics.values():
            available_metric_keys.update(m.keys())

    # Determine which metric to colour by
    if metric_key is None:
        metric_key = sorted(available_metric_keys)[0] if available_metric_keys else None
    elif metric_key not in available_metric_keys:
        raise ValueError(
            f"metric_key {metric_key!r} not found in metrics result. "
            f"Available metric keys: {sorted(available_metric_keys)}"
        )

    # Resolve colorbar limits
    if clims is not None:
        vmin, vmax = float(clims[0]), float(clims[1])
    else:
        ref_keys = (
            [base_transform_key]
            if base_transform_key in query_transform_keys
            else query_transform_keys
        )
        ref_values = []
        for pair_metrics in pairs_dict.values():
            for q in ref_keys:
                val = pair_metrics.get(q, {}).get(metric_key, np.nan)
                try:
                    val_f = float(val)
                except (TypeError, ValueError):
                    val_f = np.nan
                if not np.isnan(val_f):
                    ref_values.append(val_f)

        if len(ref_values) >= 2 and min(ref_values) < max(ref_values):
            vmin, vmax = min(ref_values), max(ref_values)
        elif ref_values:
            vmin = ref_values[0] - 0.5
            vmax = ref_values[0] + 0.5
        else:
            vmin, vmax = 0.0, 1.0

    norm = colors.Normalize(vmin=vmin, vmax=vmax)
    cmap = colormaps.get_cmap("Spectral")

    # Build the list of undirected edges (averaged over both directions) once,
    # used only when show_bboxes=False.
    if not show_bboxes:
        seen = {}
        for (fi, mi) in pairs_dict:
            key = tuple(sorted((fi, mi)))
            if key not in seen:
                seen[key] = []
            seen[key].append((fi, mi))
        undirected_edges = list(seen.keys())

    plots = {}
    for q in query_transform_keys:
        if not show_plot_positions:
            continue
        if show_bboxes:
            fig, ax = plot_positions(
                msims,
                transform_key=q,
                use_positional_colors=False,
                show_plot=False,
                plot_title=f"{metric_key}  |  transform key: {q}",
            )

            for (fi, mi), bbox in bboxes_dict.items():
                if bbox is None:
                    continue

                val = pairs_dict.get((fi, mi), {}).get(q, {}).get(metric_key, np.nan)
                try:
                    val_f = float(val)
                except (TypeError, ValueError):
                    val_f = np.nan

                color = (
                    cmap(norm(val_f)) if not np.isnan(val_f) else (0.5, 0.5, 0.5, 1.0)
                )

                lower = bbox["lower"]
                upper = bbox["upper"]

                # Project the bbox from base_transform_key world space into
                # query key world space using the fixed tile's transforms:
                # T_fixed_q @ inv(T_fixed_base) maps a base-world point to
                # query-world, so bbox corners are visualised at the correct
                # location for each query key.
                T_fixed_base = (
                    spatial_image_utils.get_affine_from_sim(sims[fi], base_transform_key)
                    .squeeze()
                    .data
                )
                T_fixed_q = (
                    spatial_image_utils.get_affine_from_sim(sims[fi], q)
                    .squeeze()
                    .data
                )
                bbox_transform = T_fixed_q# @ np.linalg.inv(T_fixed_base)

                sp = {
                    "origin": {
                        dim: float(lower[idim])
                        for idim, dim in enumerate(spatial_dims)
                    },
                    "spacing": {
                        dim: float(upper[idim] - lower[idim])
                        for idim, dim in enumerate(spatial_dims)
                    },
                    "shape": {dim: 2 for dim in spatial_dims},
                    "transform": bbox_transform,
                }
                plot_stack_props(sp, ax, color=color, linewidth=2)

            sm = plt.cm.ScalarMappable(cmap=cmap, norm=norm)
            sm.set_array([])
            plt.colorbar(sm, ax=ax, label=metric_key)

        else:
            # Minimalistic mode: colour edges by mean metric value over both
            # directed pairs.
            edge_color_vals = []
            for fi, mi in undirected_edges:
                directed = seen[(fi, mi)]
                vals = [
                    float(pairs_dict.get(d, {}).get(q, {}).get(metric_key, np.nan))
                    for d in directed
                ]
                valid = [v for v in vals if not np.isnan(v)]
                edge_color_vals.append(float(np.mean(valid)) if valid else np.nan)

            fig, ax = plot_positions(
                msims,
                transform_key=q,
                use_positional_colors=False,
                edges=undirected_edges,
                edge_color_vals=edge_color_vals,
                edge_cmap=cmap,
                edge_clims=[vmin, vmax],
                edge_label=metric_key,
                show_plot=False,
                plot_title=f"{metric_key}  |  transform key: {q}",
            )

        plt.show()

        plots[q] = (fig, ax)

    # ------------------------------------------------------------------
    # Overview plots: one figure per metric key
    # ------------------------------------------------------------------
    if show_overview_plot:
        n_keys = len(query_transform_keys)
        x_positions = list(range(n_keys))

        for mk in [metric_key]:
            fig_ov, ax_ov = plt.subplots(figsize=(max(3.5, 1.6 * n_keys + 1.2), 3.8))

            # Collect per-pair values across query keys
            pair_keys = list(pairs_dict.keys())
            all_vals_flat = []
            pair_series = []
            for pair in pair_keys:
                y_vals = []
                for q in query_transform_keys:
                    raw = pairs_dict[pair].get(q, {}).get(mk, np.nan)
                    try:
                        y_vals.append(float(raw))
                    except (TypeError, ValueError):
                        y_vals.append(np.nan)
                pair_series.append(y_vals)
                all_vals_flat.extend([v for v in y_vals if not np.isnan(v)])

            # Per-pair lines
            if overview_pair_linewidth > 0:
                for y_vals in pair_series:
                    if any(not np.isnan(v) for v in y_vals):
                        ax_ov.plot(
                            x_positions,
                            y_vals,
                            color="#9e9e9e",
                            alpha=0.55,
                            linewidth=overview_pair_linewidth,
                            marker="o",
                            markersize=3.5,
                            zorder=2,
                        )

            # Mean ± std summary per transform key
            means, stds = [], []
            for ix, q in enumerate(query_transform_keys):
                vals = [
                    float(pairs_dict[pair].get(q, {}).get(mk, np.nan))
                    for pair in pair_keys
                ]
                vals = [v for v in vals if not np.isnan(v)]
                if vals:
                    mean_v = float(np.mean(vals))
                    std_v = float(np.std(vals))
                    means.append(mean_v)
                    stds.append(std_v)
                    ax_ov.errorbar(
                        ix,
                        mean_v,
                        yerr=std_v,
                        fmt="o",
                        color="#1f77b4",
                        markersize=8,
                        linewidth=2,
                        capsize=5,
                        capthick=2,
                        zorder=4,
                    )

            # Connect the mean points with a line for easy trend reading
            valid_x = [ix for ix, q in enumerate(query_transform_keys)
                       if any(not np.isnan(float(pairs_dict[pair].get(q, {}).get(mk, np.nan)))
                              for pair in pair_keys)]
            if len(valid_x) > 1:
                mean_y = []
                for ix in valid_x:
                    q = query_transform_keys[ix]
                    vals = [float(pairs_dict[pair].get(q, {}).get(mk, np.nan))
                            for pair in pair_keys]
                    vals = [v for v in vals if not np.isnan(v)]
                    mean_y.append(float(np.mean(vals)) if vals else np.nan)
                ax_ov.plot(valid_x, mean_y, color="#1f77b4", linewidth=1.5,
                           zorder=3, alpha=0.8)

            ax_ov.set_xticks(x_positions)
            ax_ov.set_xticklabels(query_transform_keys, rotation=20, ha="right",
                                  fontsize=10)
            ax_ov.set_ylabel(mk, fontsize=11)
            ax_ov.set_xlim(-0.5, n_keys - 0.5)
            ax_ov.spines["top"].set_visible(False)
            ax_ov.spines["right"].set_visible(False)
            ax_ov.tick_params(axis="both", labelsize=9)
            ax_ov.grid(axis="y", color="#e0e0e0", linewidth=0.8, zorder=0)
            plt.tight_layout()

            plt.show()

    return plots